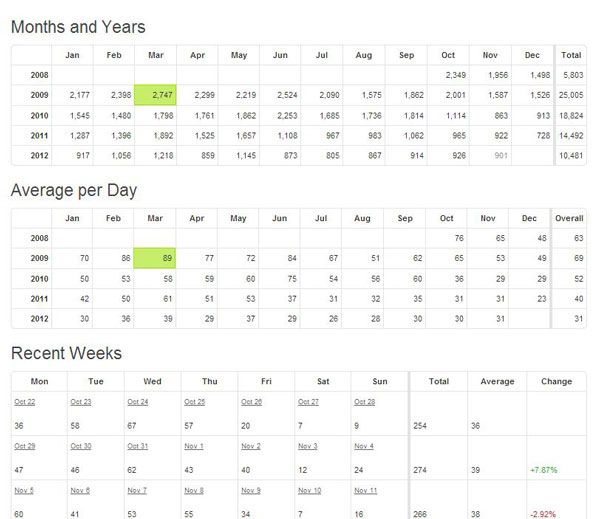
You’d think I’d have seen this: Summary Tables. Very long-term (the life-of-your-site long) stats for your sites with simple tables and even a few percentages to see growth (or contraction).
How did I stumble onto this? Because I’m less interested in how my daily stats are doing and more interested in the longer-term trends. What did I do in the month of e.g. July that made traffic spike? Oh, posted more? Gee, maybe that works. But then in August 2011, things really took a dip, might want to look into why.


